

















State Grid Corporation
Carbon Neutrality
Action Alliance
Making energy saving and green electricity a nationwide movement through community participation
Every kilowatt-hour tracked. Every gram of carbon saved tradable.
Project overview
Project Context
As China advances its carbon peaking and carbon neutrality goals, businesses and schools need energy-saving programs with measurable results, competitive challenges, and tradable reductions.
State Grid needs to mobilize communities to make energy saving and green electricity a nationwide movement.
Value Proposition
Every kilowatt-hour tracked
Every gram of carbon saved tradable
Every team recognized
Target Audience
Audience Profiles
Manufacturing ESG leads, business park property and energy managers, and campus energy-saving clubs

Manufacturing ESG Leads
Core Needs: Improving energy efficiency and corporate ESG ratings
Pain Points: Limited measurement tools make it difficult to demonstrate emissions reductions and provide sufficient data for ESG reporting.
Use Cases: Review monthly energy data, join industry challenges, and apply for green electricity PPA discounts.

Business Park Energy Managers
Core Needs: Optimizing peak and off-peak energy use and maximizing returns on equipment upgrades
Pain Points: Aging equipment, high upgrade costs, and no clear starting point for energy savings
Use Cases: Monitor the park’s energy use in real time, learn energy-saving practices, and benchmark against similar parks.

Campus Energy-Saving Clubs
Core Needs: Building environmental impact and earning recognition for their clubs
Pain Points: Activities lack supporting data, impact is difficult to measure, and incentives are limited.
Use Cases: Organize a “1,000-Person Green Run,” compete with other schools, and apply for academic credit or volunteer hours.
Core insight
Core insight
Three Key Findings from Research into China’s Climate Goals and User Behavior

Data Drives Action

Making Results Visible

Competition as Motivation
Community Design
Community Positioning and Participation Model
A Carbon Reduction Arena for Businesses and Schools
Device Connection — Data Calibration — Challenges — Green Certificate and PPA Discounts
Community Operations
- Two-Track Structure: Business Track (Manufacturers and Business Parks) + Campus Track (Universities and Schools)
- Monthly Challenges: “100-Tonne Challenge” (100 tonnes of corporate carbon reductions) + “1,000-Person Green Run” (1,000 campus participants)
- Annual Finals: Winners join the Zero-Carbon Showcase, earning State Grid recognition and media coverage.
- Data-Driven Approach: IoT devices collect real-time data, with blockchain records ensuring integrity and trust.
| Track | Participants | Key Metrics | Incentives |
|---|---|---|---|
| Enterprise Track | Manufacturers, industrial parks, commercial complexes | Carbon intensity reduction rate, share of green power consumption | PPA discounts, green certificate benefits, ESG certification |
| Campus Track | Universities, K–12 schools, vocational colleges | Per capita carbon footprint, energy-saving participation rate | Academic credits, volunteer hours, certificates of honor |
Challenge Design
100-Tonne Challenge
Goal: Cut carbon emissions by 100 tonnes in one month
Participation: Teams of 3–5 companies
Rewards: 5% off green electricity PPAs and a championship flag for the winning team
Frequency: Monthly
1,000-Person Green Run
Goal: Engage 1,000 people in energy-saving activities
Participation: Collaboration across campus clubs
Rewards: Academic credit, volunteer hours, and scholarships
Frequency: Quarterly
Zero-Carbon Showcase
Goal: Annual Carbon Reduction Champion
Participation: Qualify through points earned in monthly competitions
Rewards: State Grid Certification, Media Coverage, Industry Leadership
Frequency: Held Annually
Content Strategy
Content Cadence & Matrix
A four-part content framework: daily monitoring, weekly livestreams, monthly challenges and quarterly benchmarks
Daily Cadence
09:00 Energy Pulse Updates
12:00 Peak and Off-Peak Usage Alerts
18:00 Live Leaderboard Updates
21:00 Daily Data Summary
Weekly Activities
Wednesday Energy-Saving Tips Livestream
Friday Challenge Progress Updates
Sunday Weekly Winner Announcement
Data Review & Optimization Recommendations
Monthly Highlights
100-Tonne Challenge Launch
Data Audit & Verification
Winners’ Awards Ceremony
Benchmark Case Study Release
Quarterly Showcase
1,000-Person Green Run
Zero-Carbon Showcase Selection
Industry Summit Presentations
Annual Finals Preview
Content Matrix Examples
#100TonneChallenge# This Month’s Goal: Cut Carbon Emissions by 100t
The winning team receives a 5% discount on green power PPAs, with 3% for the runner-up and 2% for third place. A live leaderboard tracks each team’s progress with daily updates. Industrial-inspired poster design brings a high-tech edge to the energy transition.
From Air Compressors to Lighting: 4 Steps to 12% Energy Savings
A detailed guide to energy savings in manufacturing: (1) variable-speed retrofits for air compressors, saving 8–15%; (2) LED lighting upgrades, saving 60%; (3) waste heat recovery, saving 10–20%; and (4) smart energy management systems to optimize peak and off-peak usage. Supported by real-world case studies and ROI calculations.
Today’s Leaderboard: East China Manufacturing Team A Leads with 3.6t in Carbon Reductions
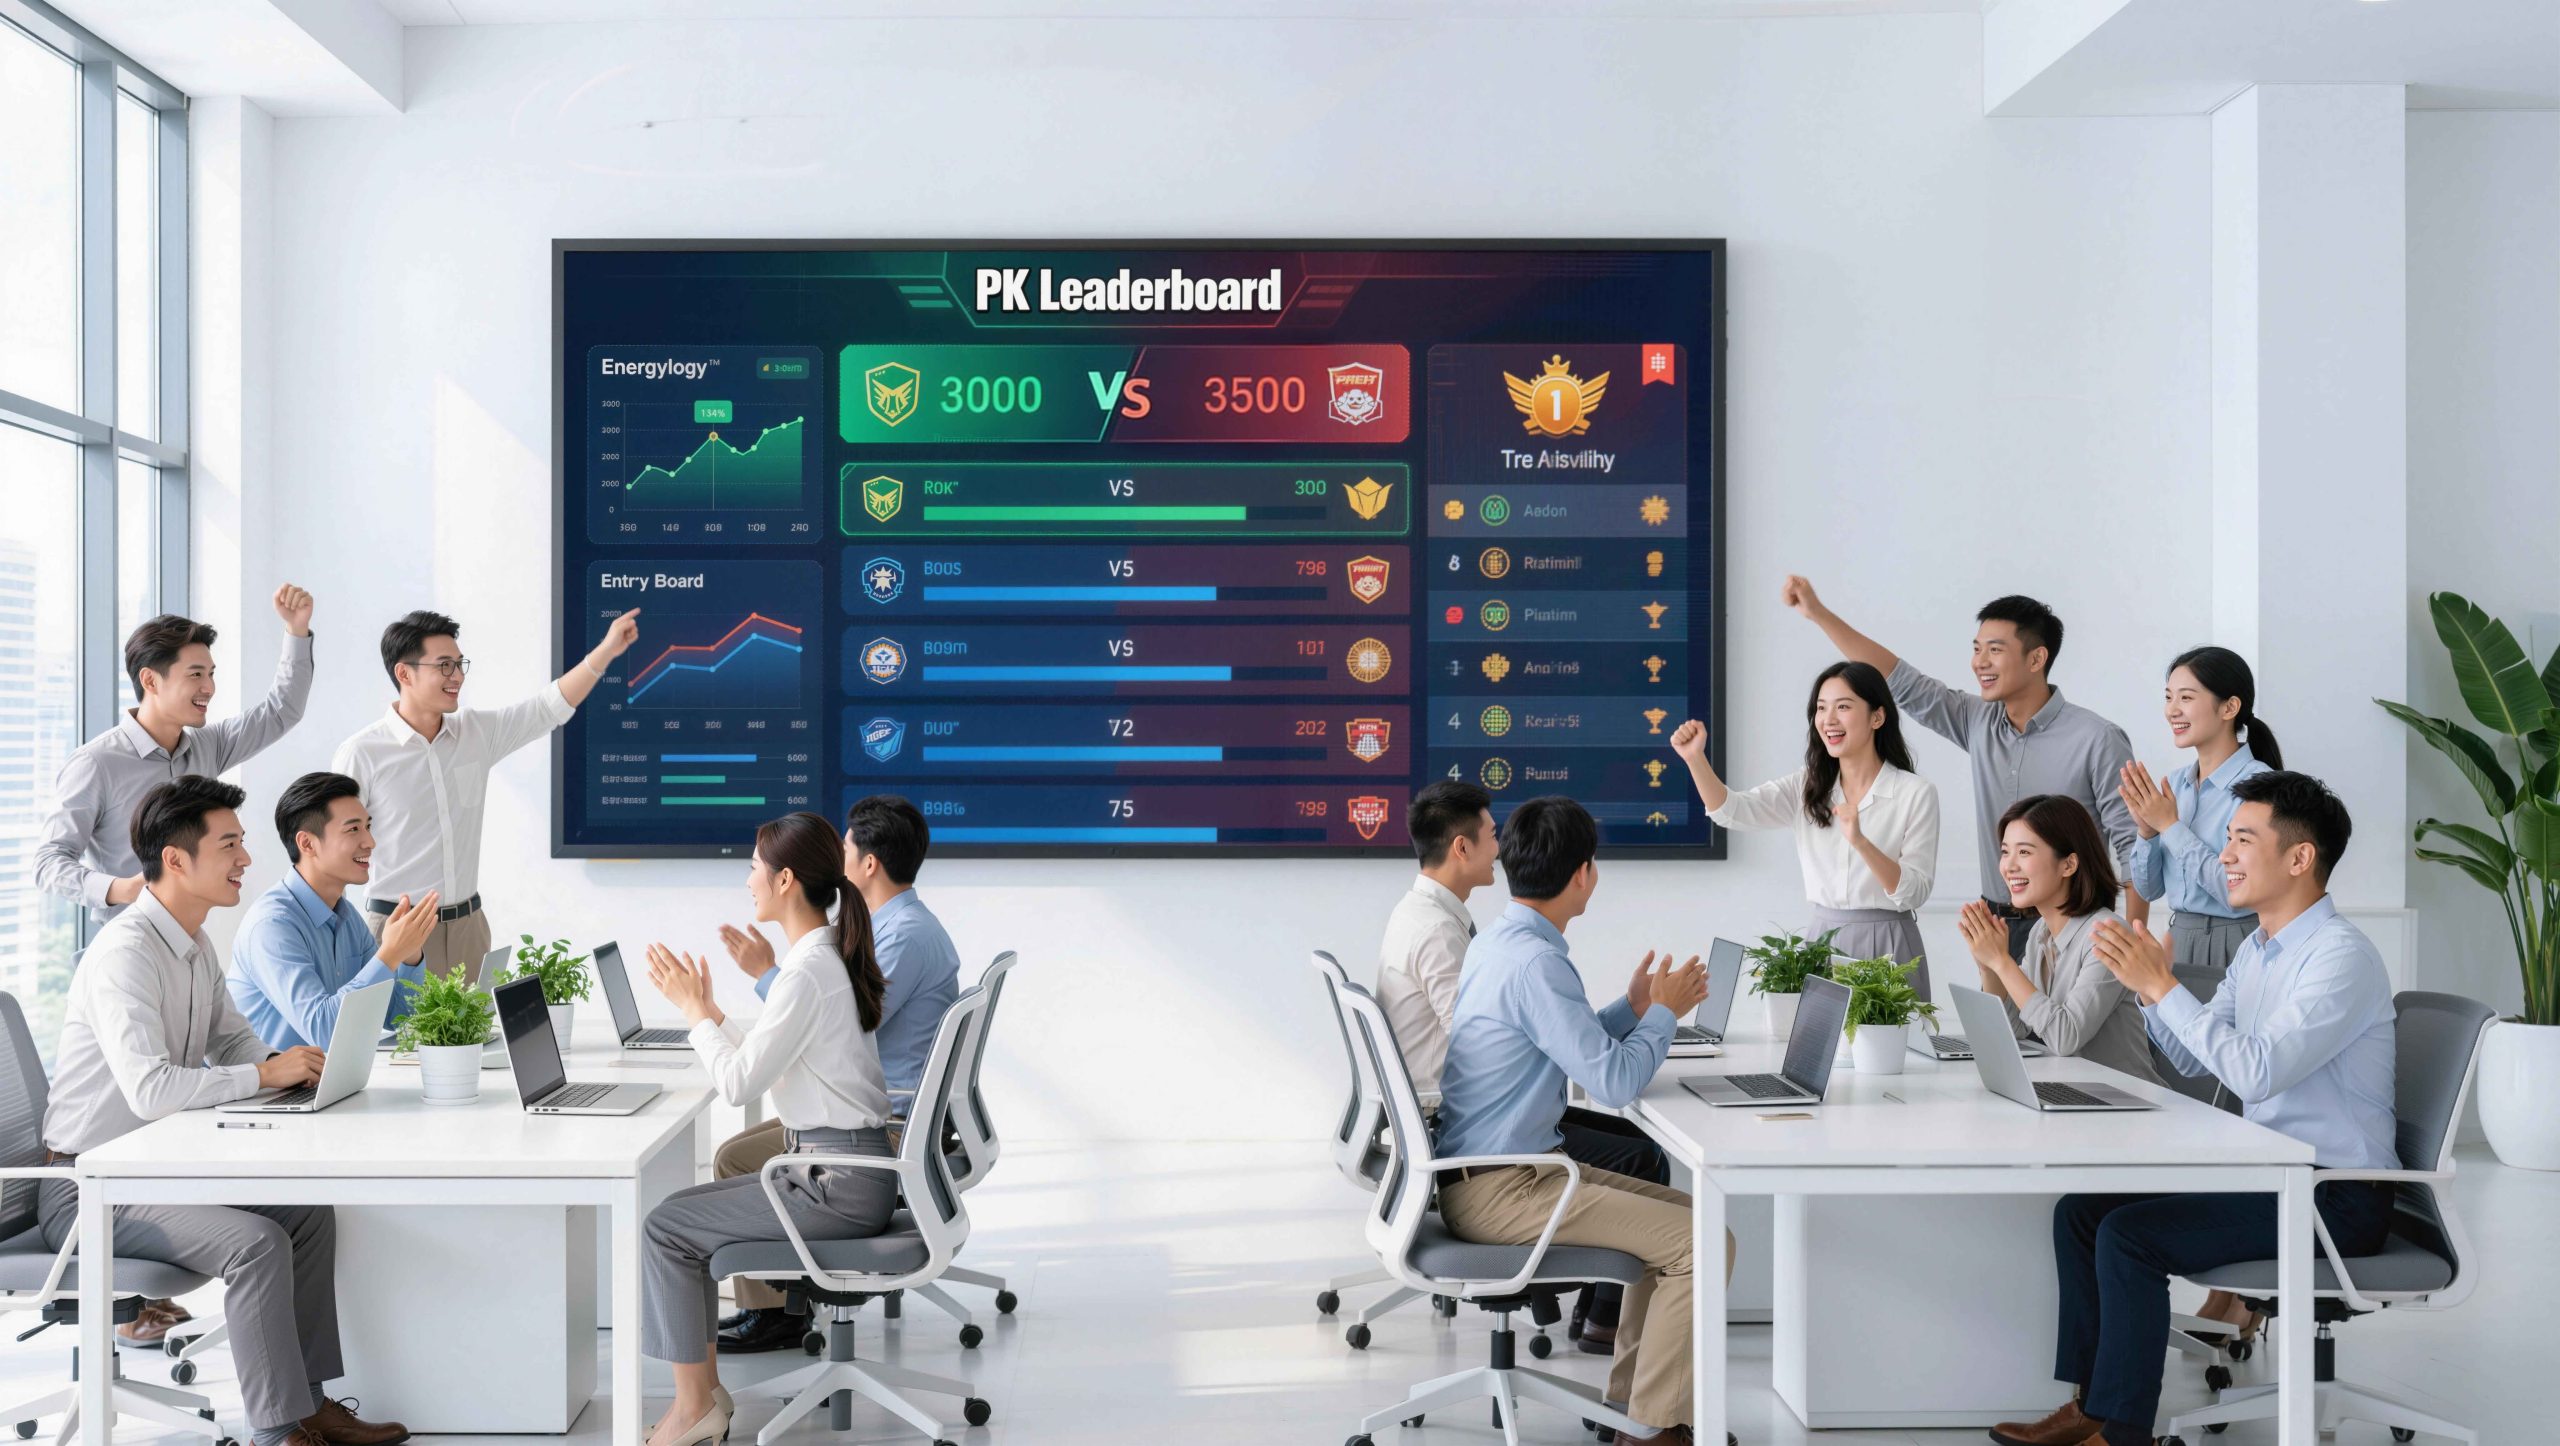
Live challenge updates fuel friendly competition. A WebGL-powered dashboard displays each team’s energy-use curves and carbon footprint maps. Updates are published daily at 18:00 and shared with business leaders and community groups.
Technology
Technology Stack & Automation
State Grid Carbon Peaking & Neutrality Platform + IoT Data Collection + WebGL Visualization + Blockchain Verification
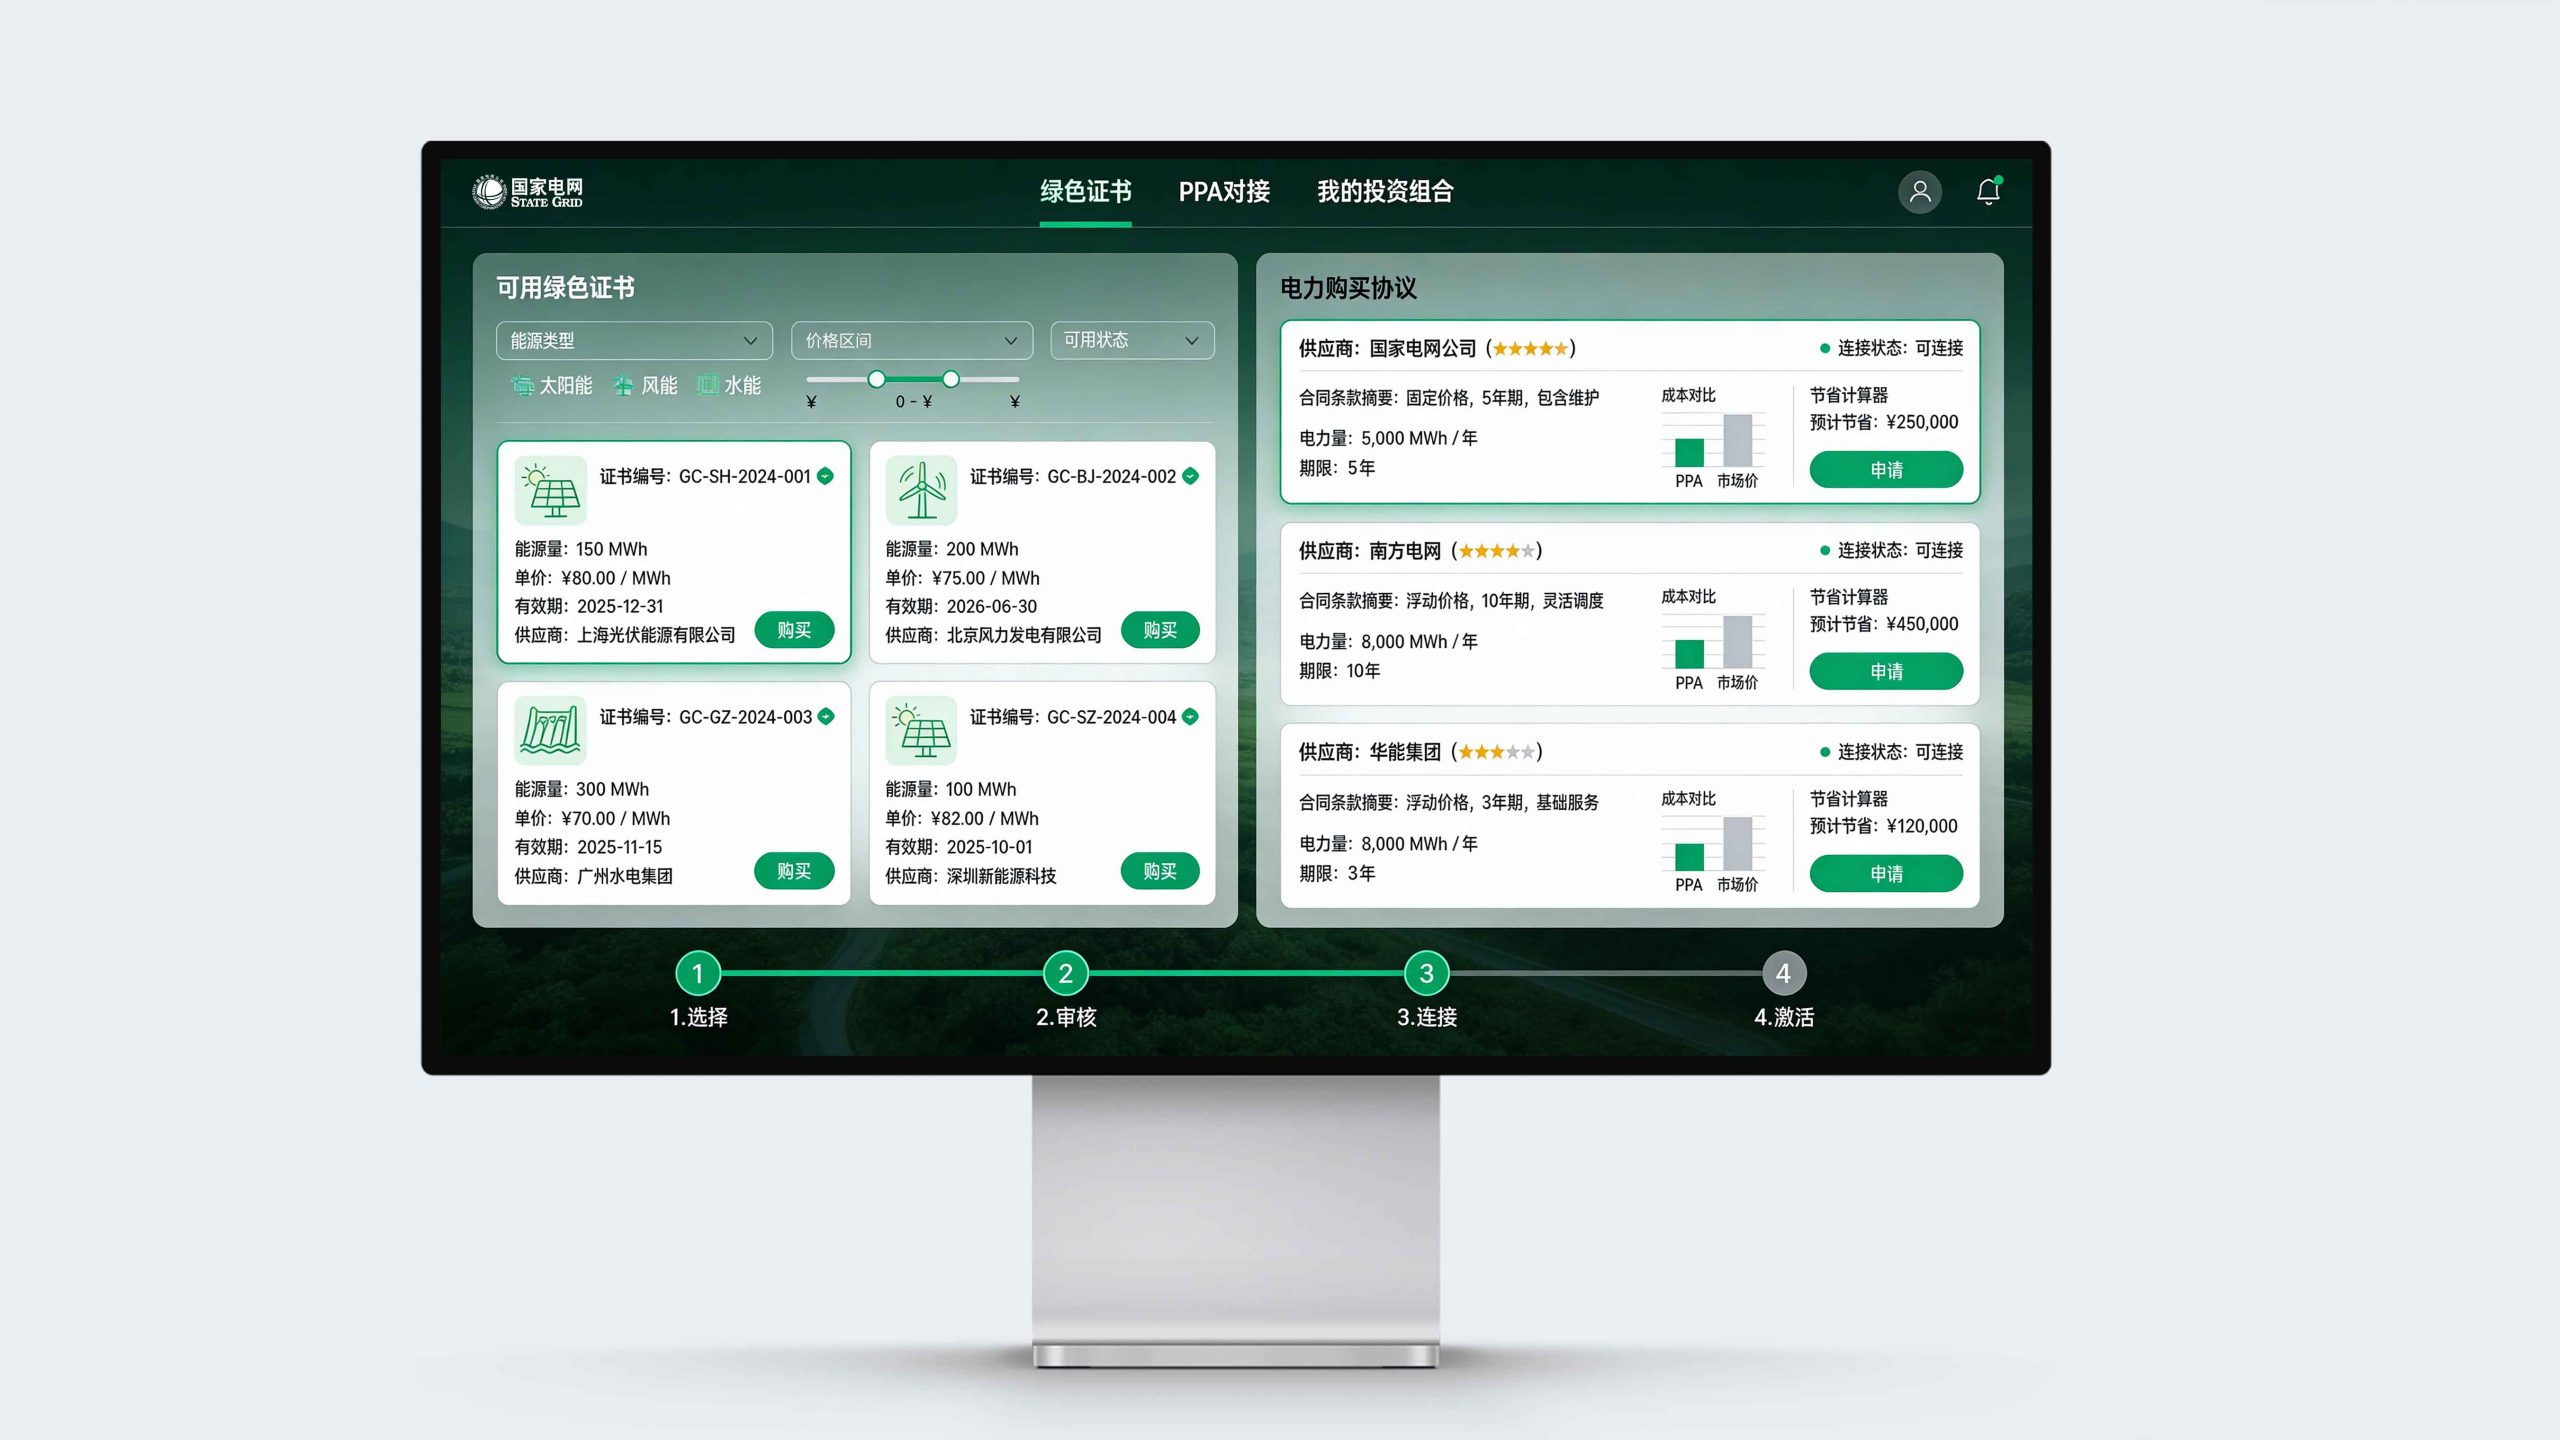
State Grid Carbon Peaking & Neutrality Platform
- Carbon Accounting & Certification
- Green Certificate & Green Power PPA Integration
- ESG Data Report Generation
- Carbon Market Access

Smart IoT Data Collection
- Real-Time Electricity, Water & Gas Meter Integration
- Energy Monitoring for HVAC, Lighting & Equipment
- Data Collection Every 5 Minutes
- Automated Alerts for Abnormal Energy Use

WebGL Visualization
- 3D Energy Maps & Heatmaps
- Live Carbon Emissions Pulse Animation
- Team Comparison Dashboard
- Historical Trends & Forecast Curves
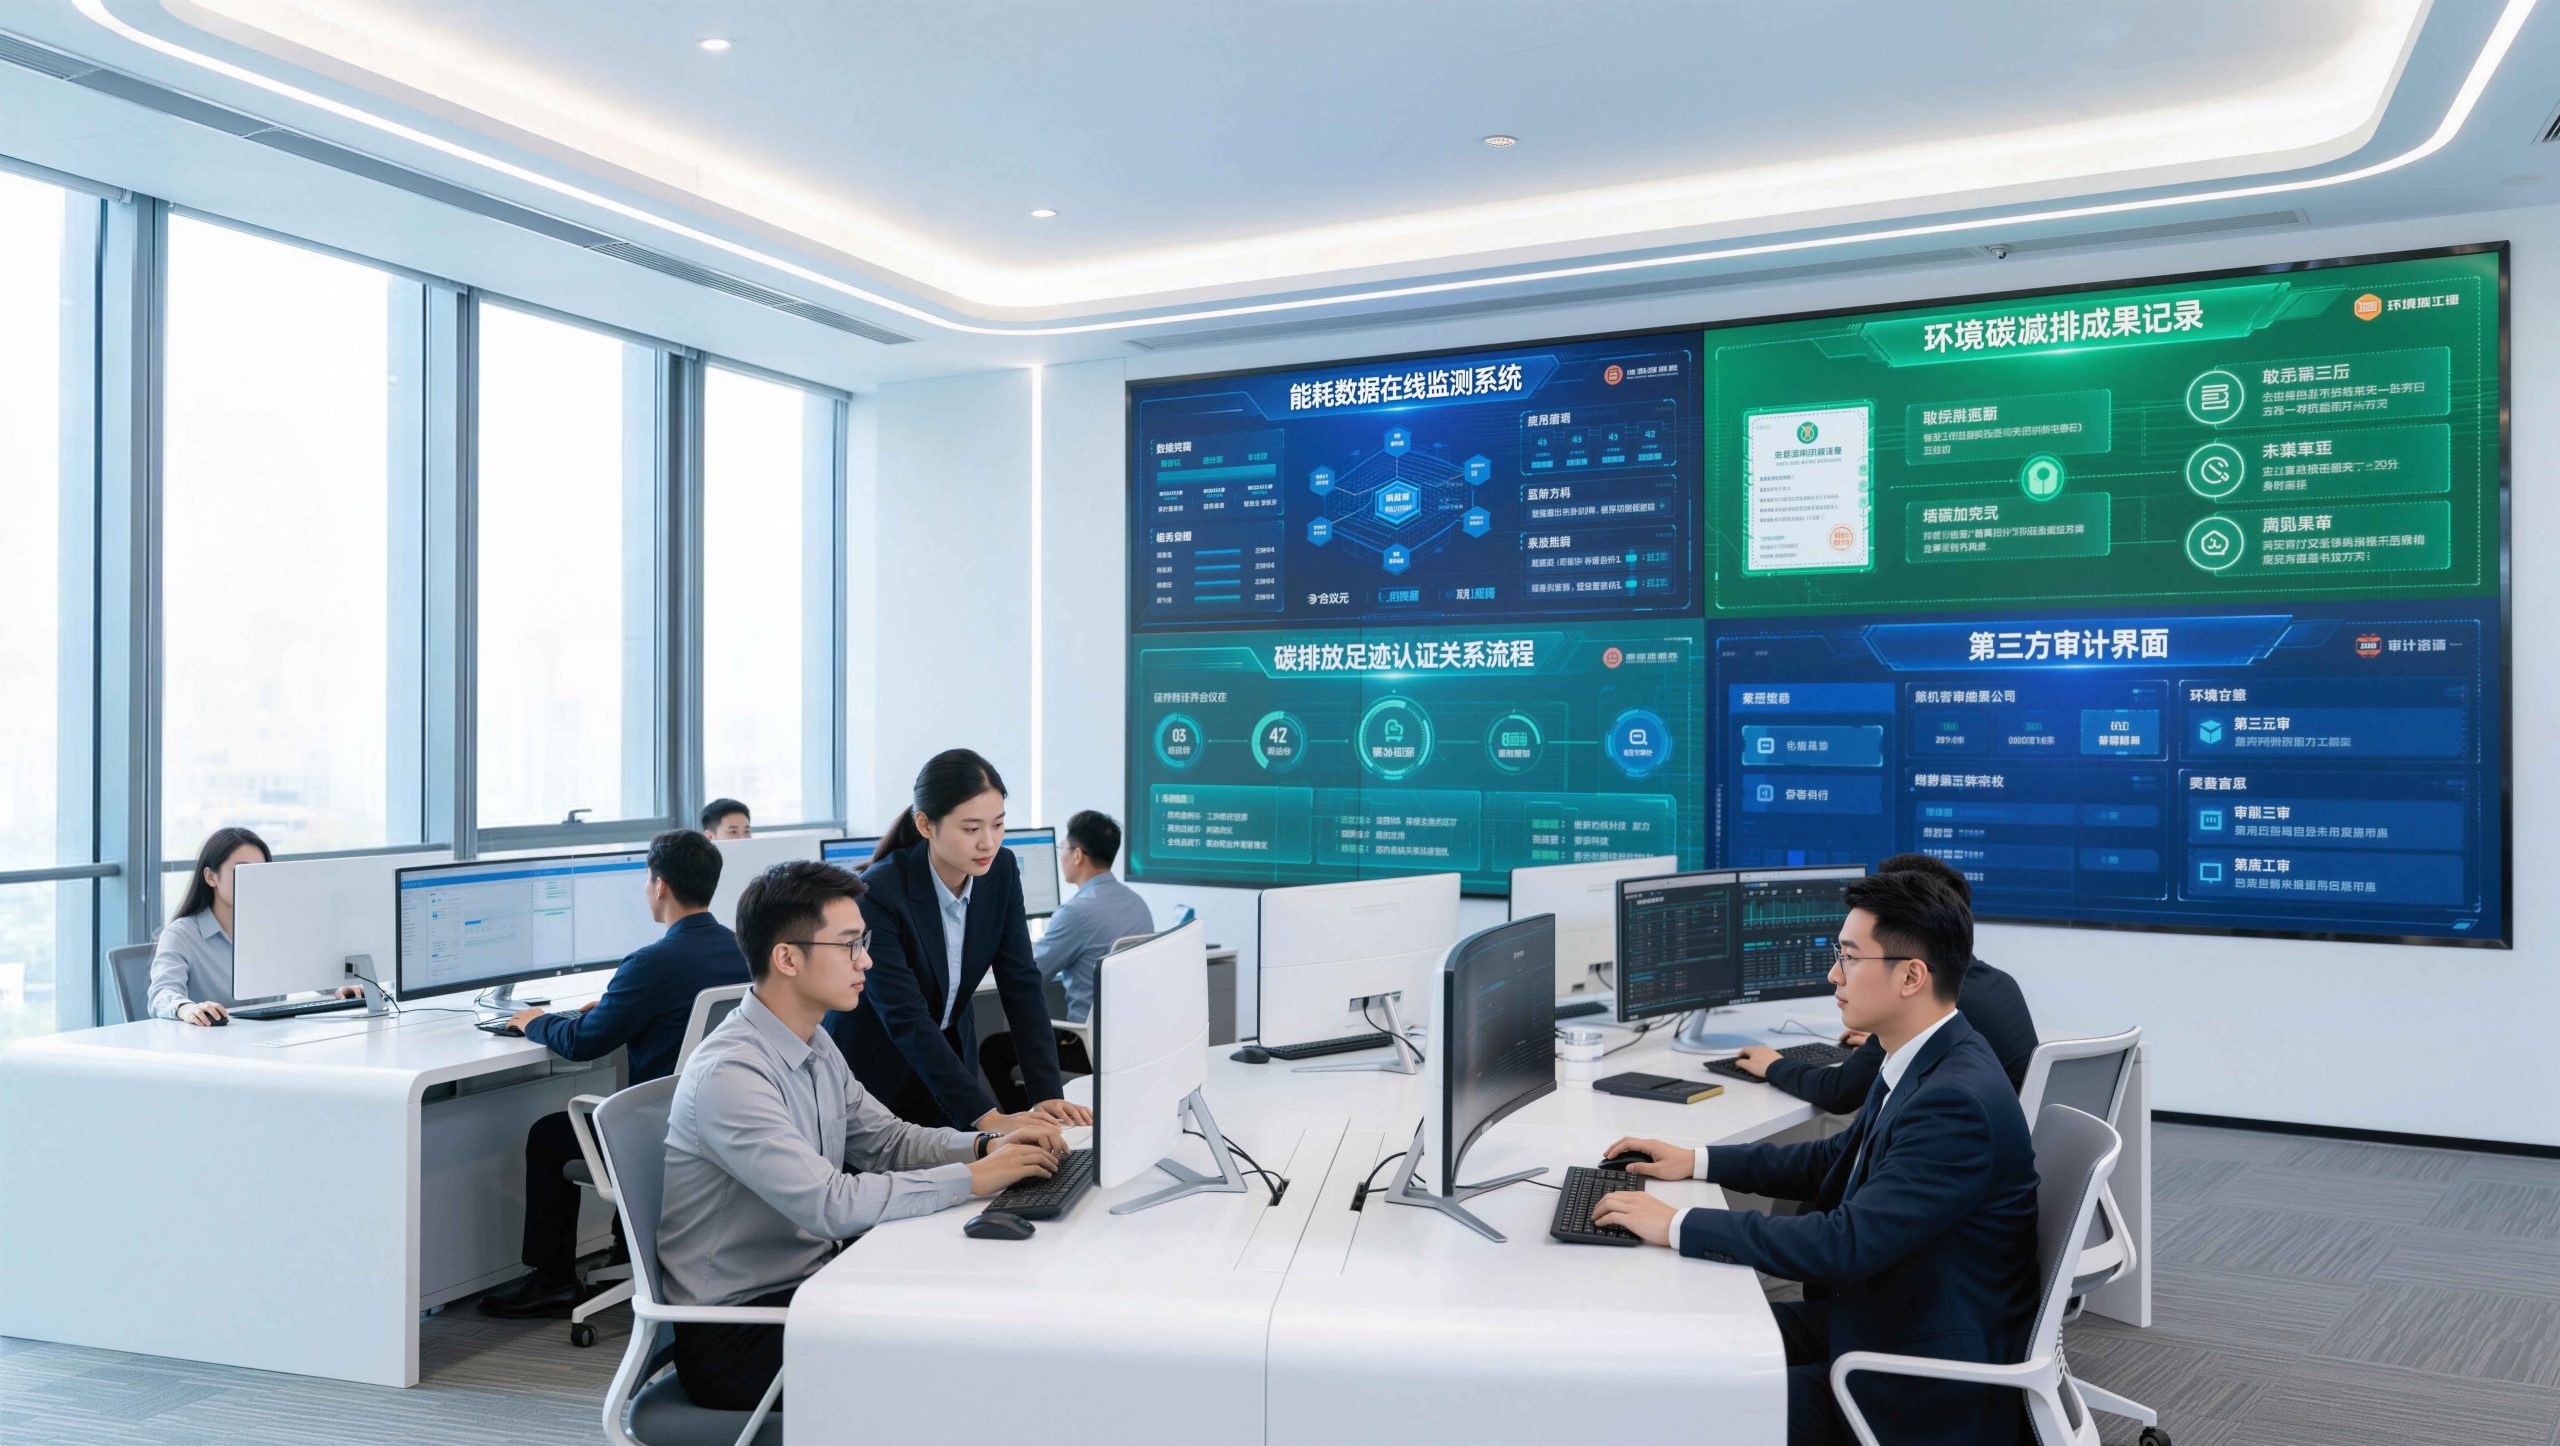
Blockchain Verification
- On-Chain Energy Data Records
- Tamper-Proof Carbon Reduction Records
- Transparent, Traceable Green Certificate Transactions
- Third-Party Audit Interface
Automation SOPs
- Device Integration Sign-Off: Submit equipment inventory → State Grid engineer site survey → IoT device installation → Data connection testing → Integration approval
- Data Calibration: Baseline data collection (7 days) → Outlier filtering → Cross-validation across data sources → Calibration factor calculation → Full operation
- Challenge Registration: Enter company details → Select challenge track and form a team → Set carbon reduction targets → Pay deposit → Begin challenge
- End-to-End Monitoring: Data collection every 5 minutes → Real-time carbon emissions calculation → Anomaly alerts → Manual review → Leaderboard update
- Results Audit: Third-party spot checks → Blockchain data verification → On-site equipment inspection → Results publication → Awards
Implementation
Implementation Roadmap
A 240-day roadmap from device integration to zero-carbon showcase selection
Key Actions: Recruit the first 20 pilot companies and 10 pilot universities
Technical Readiness: Complete the carbon peaking and neutrality platform and procure equipment
Frequency: 4 Weeks
Testing Priorities: Data accuracy, visualization performance and user experience
Pilot Rollout: 20 companies + 10 universities, collecting 30 days of baseline data
Frequency: 8 Weeks
Communications Strategy: Trade media coverage, employee engagement and government endorsement
Incentives: 5% off renewable electricity PPAs, ESG certification and media exposure
Frequency: 12 weeks, including a 1-month challenge and 2-month review
Places Available: 60 companies in the enterprise category and 40 schools and universities in the education category
Support Provided: On-site assessments by State Grid experts, free energy-efficiency upgrade plans and a nationwide showcase tour
Frequency: Ongoing Operations
Performance Dashboard
Data Dashboard and Key Metrics
Track emissions reductions in real time to inform policy improvements and resource allocation
| Metric Type | Key Metrics | Target | Tracking Frequency |
|---|---|---|---|
| Emission Reduction Metrics | Cumulative carbon reduction | 100,000 tonnes | Daily |
| Emission Reduction Metrics | Reduction in energy intensity | 12%+ | Monthly |
| Business Metrics | Corporate PPA contracted capacity | 500 MW | Monthly |
| Business Metrics | Green certificate trading volume | RMB 50 million | Quarterly |
| Engagement Metrics | Active enterprises | 500 | Monthly |
| Engagement Metrics | Active campuses | 200 | Monthly |
| Impact Metrics | Zero-carbon showcases | 100 | Annually |
| Impact Metrics | Media coverage | 500+ articles | Quarterly |
Data Analysis Dimensions
- By Region: Compare emissions reductions across East, North, South and Southwest China to optimize resource allocation
- By Sector: Analyze performance across manufacturing, commercial real estate, universities and primary and secondary schools
- By Technical Approach: Assess the contribution of equipment upgrades, energy-saving behaviors and renewable electricity use to emissions reductions
- By Time Period: Identify energy-use patterns across weekdays and weekends, summer and winter
- Communications Impact: Assess how media coverage, social sharing and government recognition affect participation
Budget Allocation
Budget and Timeline
An initial RMB 2.2 million investment across four areas: data integration, incentives, events and operations
Data Integration: 35%
- IoT equipment procurement and installation: RMB 400,000
- Carbon peaking and neutrality platform development: RMB 250,000
- Data calibration and auditing: RMB 80,000
- Blockchain-based record verification: RMB 40,000
Incentive Program: 30%
- PPA discount subsidies: RMB 350,000
- Green certificate discounts: RMB 150,000
- Campus rewards, including academic credits and volunteer hours: RMB 100,000
- Prizes and certificates: RMB 60,000
Event Delivery: 20%
- 100-Tonne Challenge delivery: RMB 200,000
- 1,000-person Green Run: RMB 120,000
- Zero-Carbon Showcase Site selection: RMB 80,000
- Annual summit and awards: RMB 40,000
Content and Communications: 15%
- Content production, including articles, videos and posters: RMB 150,000
- Media placements and PR: RMB 100,000
- Influencer partnerships: RMB 50,000
- Community management staffing: RMB 30,000
Budget Optimization Recommendations
- Equipment Reuse: IoT equipment can be reused across companies, reducing equipment costs by 60% in year two
- Economies of Scale: As participation grows, the grid operator absorbs PPA discount costs, freeing up the incentive budget
- Organic Reach: Flagship projects generate organic reach, reducing the communications budget by 50% in year two
- Government Subsidies: Local government funding for energy conservation and emissions reduction can cover 30–50% of costs
Risk Management
Risks & Mitigation
Identify technical, policy and operational risks, and establish prevention and response measures
Key Risks
- Data Quality: Equipment failures, manual interference and falsified data can distort reported emissions reductions
- Policy Changes: Carbon price fluctuations, PPA policy adjustments and changes to green certificate standards can weaken incentives
- Cheating and Ranking Manipulation: Deliberate power cuts, data tampering and fraudulent device connections undermine fair competition
- Privacy and Compliance: Corporate energy-use data may contain trade secrets, while campus data requires safeguards for minors
- Technical Reliability: IoT disconnections, platform outages and slow dashboard loading can disrupt the user experience
Mitigation Measures
- Data Calibration and Auditing: 7-day baseline data collection + cross-checking across multiple data sources + independent audits + blockchain-based record verification
- Dynamic Meter Adjustment: Monitor policy changes in real time and adjust PPA discounts and green certificate prices quarterly to keep incentives attractive
- Algorithmic Anomaly Detection: AI models detect unusual energy-use patterns, such as sudden outages or data spikes, and flag them for human review.
- Data Anonymization and Access Control: Enterprise data is shown only as relative measures, such as rankings and growth rates, without disclosing absolute figures. Campus data contains no personal information.
- Technical Redundancy: Hot standby across two servers, dual 4G and wired connections for IoT devices, and a WebGL fallback.
Compliance Checklist
- Data Security: Level 3 certification under China’s Multi-Level Protection Scheme, encrypted data transmission, and isolated storage.
- Green Certificate Compliance: All green certificates must be certified by the National Energy Administration, with a transparent, publicly documented transaction process.
- Competition Transparency: Challenge rules, scoring criteria, and results are published, with appeals and reviews available.
- Protection of Minors: The campus track collects no student personal information; only participation totals are recorded.
Expected Outcomes
Expected Outcomes and Industry Benchmarks
Reasonable projections based on pilot data and international experience.
Equivalent to planting five million trees
Driving growth in green electricity consumption
Setting an industry benchmark
| Dimension | Conventional Energy-Saving Programs | Green Energy Alliance | Improvement |
|---|---|---|---|
| Engagement | Passive compliance, 30% participation | Active competition, 80%+ participation | Up 150% |
| Emission Reduction Impact | One-off retrofits, diminishing returns | Continuous optimization, 12% average annual reduction | Sustained improvement |
| Data Transparency | Annual disclosure, lagging data | Real-time monitoring, blockchain-verified records | 100% traceable |
| Brand Value | Internal results, invisible externally | Media coverage, industry benchmark | ESG rating uplift |
| Payback period | 3–5 years | 1.5–2 years (incl. PPA incentives) | 50%+ shorter |
Key points
A Replicable Methodology
A community engagement framework for China’s dual-carbon goals, developed from the State Grid case.

Measure + Visualize
Compete + Reward

Verify + Trade
The Core Formula
Emissions reduction = Data transparency × Strength of incentives × Competitive momentum
All three are essential
Without transparent data, there is no trust. Without meaningful incentives, there is no motivation. Without competition, momentum fades.